Market Outlook
April 5, 2017
Market Cues
Domestic Indices
Chg (%)
(Pts)
(Close)
Indian markets are likely to open flat tracking the SGX Nifty & Asian markets.
BSE Sensex
1.0
290
29,910
US markets closed slightly higher Tuesday as investors exercised caution ahead of a
Nifty
0.7
64
9,238
meeting between President Donald Trump and Chinese counterpart Xi Jinping. The
Mid Cap
0.7
93
14,190
Dow Jones Industrial Average closed up 0.2%, at 20,689. The S&P 500 index
Small Cap
1.3
186
14,620
finished up 0.1%, at 2,360 with the energy and materials sectors leading gainers.
Bankex
0.7
164
24,584
The UK markets rose for the first time in four sessions on Tuesday, boosted by a
weaker pound, with precious-metals miners among the biggest advancers on the
Global Indices
Chg (%)
(Pts)
(Close)
back of solid gains for gold and silver prices. The FTSE 100 climbed 0.5% to end at
7,322, rebounding from a 0.5% drop on Monday.
Dow Jones
0.2
39
20,689
Nasdaq
0.1
4
5,899
Indian markets were closed on Tuesday. On Monday however, the rally in Indian
FTSE
0.5
39
7,322
markets continued indicating a positive start of new fiscal. The benchmark Sensex
Nikkei
0.3
49
18,859
and Nifty indices closed at record highs as global equities rode a liquidity wave. FIIs
have been net buyers for 20 straight sessions to 31 March and in FY17, they have
Hang Seng
0.3
64
24,325
infused $6.2 billion in Indian equities. On Monday, BSE’s 30-share Sensex closed
Shanghai Com
1.0
31
3,254
0.98%, higher at 29,910 points, a record close. The National Stock Exchange’s 50-
share Nifty closed up 0.72%, at a record closing level of 9,238 points.
Advances / Declines
BSE
NSE
News Analysis
Advances
2,084
1,273
Indoco Remedies: Update
Declines
836
421
2W Auto Sales Update
Unchanged
124
68
Detailed analysis on Pg2
Investor’s Ready Reckoner
Volumes (` Cr)
Key Domestic & Global Indicators
BSE
3,751
Stock Watch: Latest investment recommendations on 150+ stocks
NSE
22,072
Refer Pg5 onwards
Net Inflows (` Cr)
Net
Mtd
Ytd
Top Picks
FII
3,490
33,782
44,220
CMP
Target
Upside
Company
Sector
Rating
(`)
(`)
(%)
MFs
1,860
2,368
9,438
Amara Raja Batteries Auto & Auto AncillaryAccumulate
909
1,009
11.0
HCL Tech
IT
Accumulate
865
1,000
15.6
Top Gainers
Price (`)
Chg (%)
Power Grid Corp.
Power
Accumulate
196
223
13.6
Navkar Corp.
Others
Buy
175
265
51.2
Bajajelec
373
19.2
KEI Industries
Others
Accumulate
190
207
9.1
Deltacorp
214
18.1
More Top Picks on Pg3
Network18
40
12.8
Dishman
324
11.6
Key Upcoming Events
Previous
Consensus
Marksans
51
8.4
Date
Region
Event Description
Reading
Expectations
Apr 05, 2017 US
Initial Jobless claims
258.00
250.00
Apr 06, 2017 Germany PMI Services
55.60
55.60
Top Losers
Price (`)
Chg (%)
Apr 06, 2017 India
RBI Reverse Repo rate
5.75
5.75
Unitech
5
(9.0)
Apr 06, 2017 UK
Industrial Production (YoY)
3.20
3.70
Unitdspr
2,048
(5.8)
Apr 06, 2017 India
RBI Repo rate
6.25
6.25
Dishtv
103
(4.8)
Apr 07, 2017 India
RBI Cash Reserve ratio
4.00
4.00
Hathway
37
(3.3)
More Events on Pg4
Carerating
1,607
(3.1)
As on April 03, 2017
Market Outlook
April 5, 2017
News Analysis
Indoco Remedies: Update
The USFDA had inspected Indoco Remedies manufacturing facilities (Plant II &
Plant III, L-32,33,34 Verna Industrial Estate Area, Verna, Goa), from August 31st
2016 to September 4th, 2016.As an outcome of this inspection, the facility
received 6 observations in Form 483, which do not pertain to data integrity. Based
on the review of compliance response, USFDA accepted company’s response to 4
observations. However, FDA remains concerned with respect to 2 observations,
pertaining to one specific product, for which the company is contract
manufacturer, for one of its customers and consequently, the company has
received a warning letter from USFDA dated 27th March 2017. The company is
fully committed in resolving the issue and will respond at the earliest.
As per the company, warning letter pertains to issue of leakages in the product
Latanoprost, which has sales of `25cr p.a. Revenue exposure of plant under
warning to U.S. is `75cr, out of the total U.S. business of `110cr. In terms of
number of ANDAs pending from Plant III is 9, while number of ANDAs pending
from Plant II is 18. While the company does not expect disruptions in supplies as of
now, it expects the delay in approvals in future. AS of now the damage is very
minimal to the US operations of the company and even in the worst come situation
( if all the `75cr sales are under pressure), the impact on the net profit is expected
to around 6-7%. We maintain neutral on the stock.
2W Auto Sales Update
Bajaj Auto:
11% decline in total sales to 2,72,197 units in March-17. Domestic
motorcycle sales declined by 14% while exports declined by 6% in March-17.
Domestic CV sales declined by 35% while exports declined by 28%.
Hero MotoCorp: Total sales of 6,09,951 units in March-17 vs. 6,06,542 units in
March-16 showing 1% growth.
Eicher Motors : Royal Enfield sales jumped by 17% to 60,113 units in March-17.
TVS Motor Company: March-17 2W sales increased by 10.7%. Domestic 2W sales
grew by 8.4% while exports grew by 28.5%. Total 3W sales declined by 8.7%.
Economic and Political News
RBI clears proposal to introduce `200 notes
Govt plans new equity savings scheme with bigger tax benefits, easier norms
Foreign investors give Modi a CAD edge over Manmohan for the first time in
26 years
Exports saving grace for domestic companies
Corporate News
Donald Trump begins crackdown on H-1B visa programme
Essar sells BPO unit Aegis to Capital Square Partners
BS-III vehicles ban to cost auto companies nearly `3,000 crore: Crisil
Infosys strongly defends COO pay hike criticized by Narayana Murthy
Petronas plans to invest $150 million in India's lubricant market
Market Outlook
April 5, 2017
Top Picks ★★★★★
Large Cap
Market Cap
CMP
Target
Upside
Company
Rationale
(` Cr)
(`)
(`)
(%)
To outpace battery industry growth due to better technological
Amara Raja Batteries
15,526
909
1,009
11.0products leading to market share gains in both the automotive
OEM and replacement segments.
The stock is trading at attractive valuations and is factoring all the
HCL Tech
1,22,099
865
1,000
15.6
bad news.
Back on the growth trend, expect a long term growth of 14% to
Infosys
2,31,865
1,009
1,249
23.7
be a US$20bn in FY2020.
One of the largest pharma companies with strong international
Lupin
64,781
1,435
1,809
26.1presence. It has a rich pipeline of ANDAs which is also one of the
largest among the generic companies.
Going forward, we expect the company to report strong top-line
Power Grid Corporation
1,02,670
196
223
13.6CAGR of ~16% and bottom-line CAGR of ~19% over FY16-18
on back of strong capitalization guidance
Source: Company, AngelResearch
Mid Cap
Market Cap
CMP
Target
Upside
Company
Rationale
(` Cr)
(`)
(`)
(%)
We expect the company would report strong profitability
Asian Granito
1,108
368
390
5.9
owing to better product mix, higher B2C sales and
amalgamation synergy.
Among the top 4 players in the consumer durables segment.
Bajaj Electricals
3,776
373
395
6.0
Improved profitability backed by turn around in E&P segment.
Strong order book lends earnings visibility.
Favourable outlook for the AC industry to augur well for
Cooling products business which is out pacing the market
Blue Star
6,749
706
760
7.6
growth. EMPPAC division's profitability to improve once
operating environment turns around.
Strong loan growth backed by diversified loan portfolio and
Equitas Holdings
5,762
171
235
37.7
adequate CAR. ROE & ROA likely to remain decent as risk of
dilution remains low. Attractive valuations considering growth.
Economic recovery to have favourable impact on advertising
& circulation revenue growth. Further, the acquisition of a
Jagran Prakashan
6,095
186
225
20.7
radio business (Radio City) would also boost the company's
revenue growth.
High order book execution in EPC segment, rising B2C sales
KEI Industries
1,475
190
207
9.1
and higher exports to boost the revenues and profitability
Speedier execution and speedier sales, strong revenue visibilty
Mahindra Lifespace
1,606
391
522
33.4
in short-to-long run, attractive valuations
Higher growth in domestic branded sales and healthy export
Mirza International
1,040
86
107
23.8
to boost the profitability.
Massive capacity expansion along with rail advantage at ICD
Navkar Corporation
2,499
175
265
51.2
as well CFS augurs well for the company
Strong brands and distribution network would boost growth
Siyaram Silk Mills
1,594
1,701
1,872
10.1
going ahead. Stock currently trades at an inexpensive
valuation.
Market leadership in Hindi news genre and no. 2 viewership
ranking in English news genre, exit from the radio business,
TV Today Network
1,552
260
344
32.3
and anticipated growth in ad spends by corporates to benefit
the stock.
Source: Company, Angel Research
Market Outlook
April 5, 2017
Key Upcoming Events
Global economic events release calendar
Bloomberg Data
Date
Time
Country
Event Description
Unit
Period
Last Reported
Estimated
Apr 05, 2017
6:00 PM US
Initial Jobless claims
Thousands
Apr 1
258.00
250.00
Apr 06, 2017
1:25 PM Germany
PMI Services
Value
Mar F
55.60
55.60
2:30 PM India
RBI Reverse Repo rate
%
Apr 6
5.75
5.75
2:00 PM UK
Industrial Production (YoY)
% Change
Feb
3.20
3.70
2:30 PM India
RBI Repo rate
%
Apr 6
6.25
6.25
Apr 07, 2017
2:30 PM India
RBI Cash Reserve ratio
%
Apr 6
4.00
4.00
6:00 PM US
Change in Nonfarm payrolls
Thousands
Mar
235.00
175.00
6:00 PM US
Unnemployment rate
%
Mar
4.70
4.70
Apr 10, 2017
India
Imports YoY%
% Change
Mar
21.76
India
Exports YoY%
% Change
Mar
17.48
Apr 11, 2017
2:00 PM UK
CPI (YoY)
% Change
Mar
2.30
Apr 12, 2017
2:00 PM UK
Jobless claims change
% Change
Mar
-11.30
5:30 PM India
Industrial Production YoY
% Change
Feb
2.70
7:00 AM China
Consumer Price Index (YoY)
% Change
Mar
0.80
1.10
April 13, 2017
US
Producer Price Index (mom)
% Change
Mar
0.10
6:00 PM US
Consumer price index (mom)
% Change
Mar
0.10
-0.10
April 14, 2017
China
Exports YoY%
% Change
Mar
-1.30
3.20
Apr 17, 2017
12:00 PM India
Monthly Wholesale Prices YoY%
% Change
Mar
6.55
7:30 AM China
Industrial Production (YoY)
% Change
Mar
6.00
7:30 AM China
Real GDP (YoY)
% Change
1Q
6.80
Apr 18, 2017
6:00 PM US
Housing Starts
Thousands
Mar
1288.00
1275.00
6:00 PM US
Building permits
Thousands
Mar
1216.00
1260.00
6:45 PM US
Industrial Production
%
Mar
0.11
0.45
Apr 19, 2017
2:30 PM Euro Zone Euro-Zone CPI (YoY)
%
Mar F
1.50
Apr 20, 2017
7:30 PM Euro Zone Euro-Zone Consumer Confidence
Value
Apr A
-5.00
Source: Bloomberg, Angel Research
Market Outlook
April 5, 2017
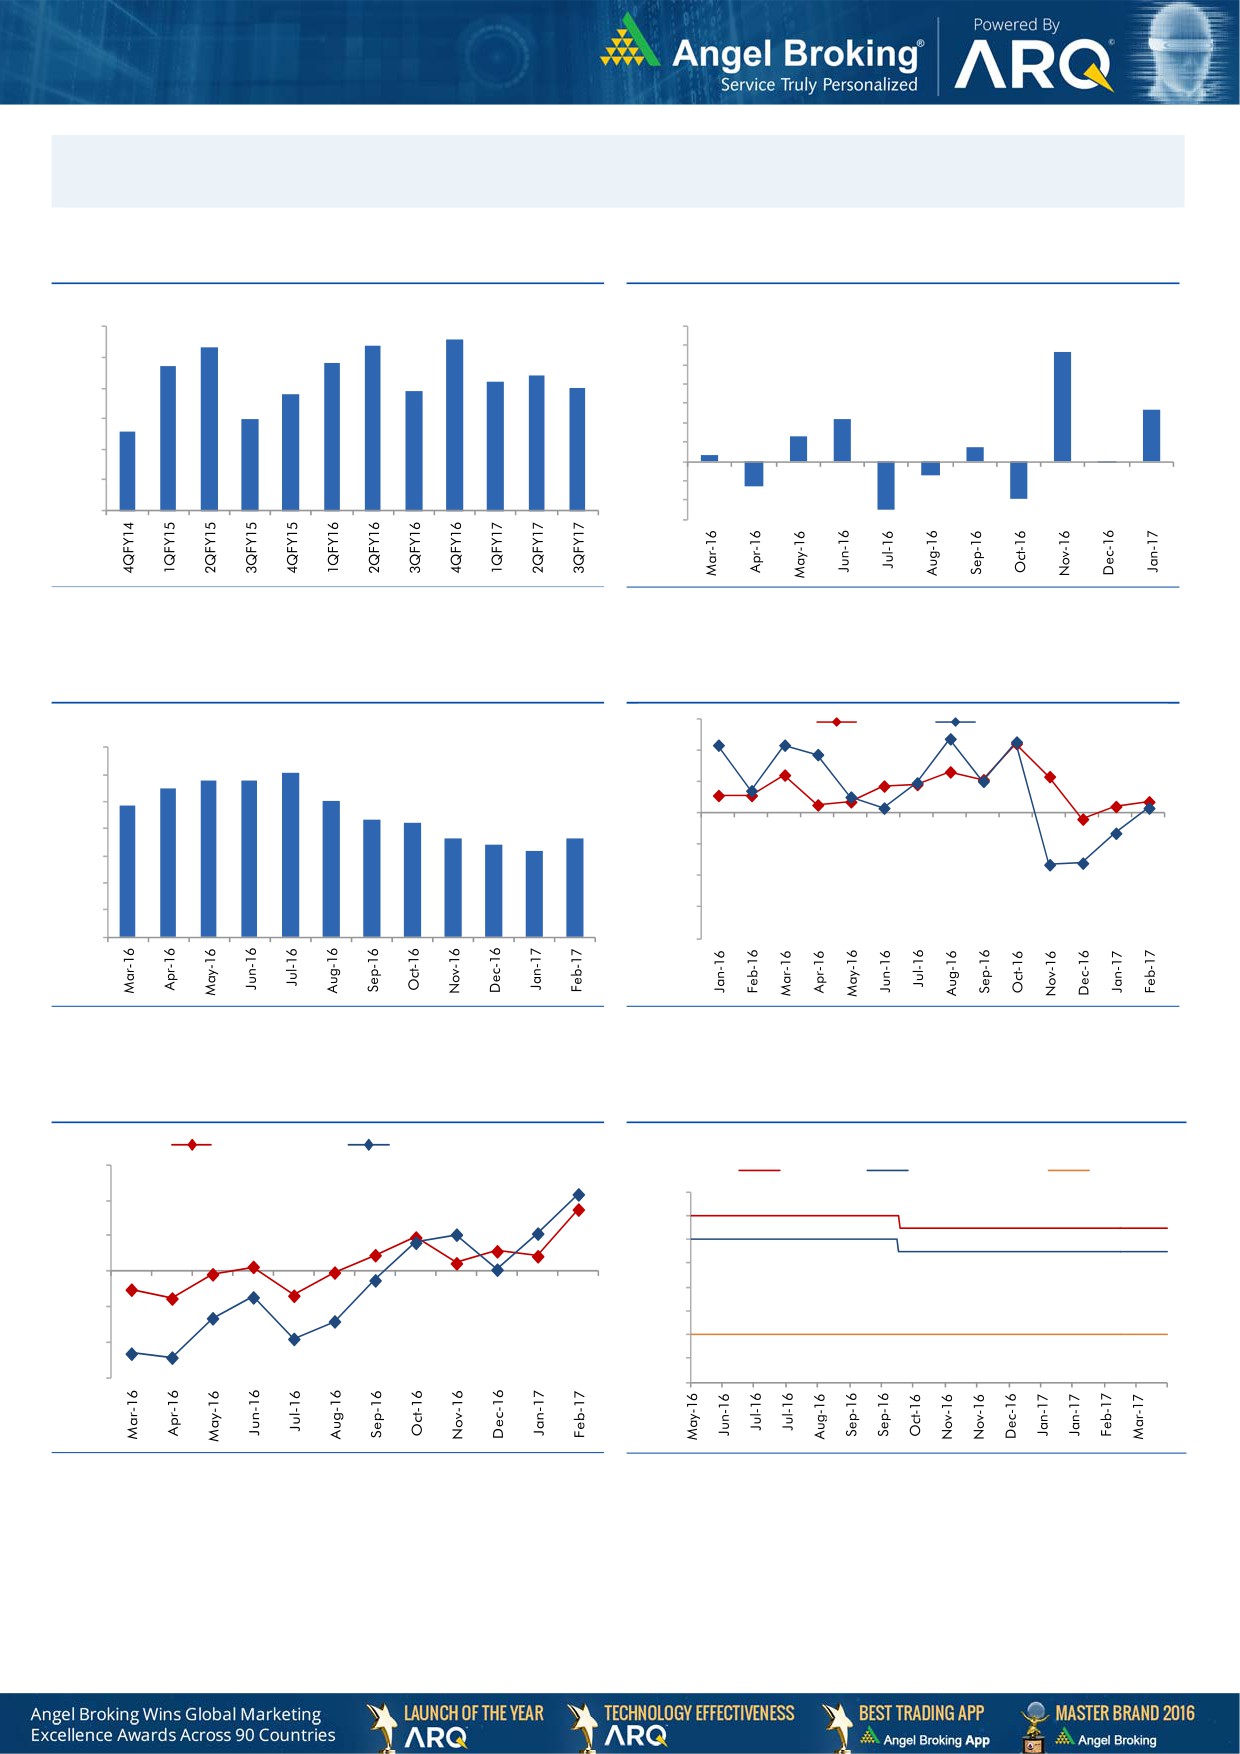
Macro watch
Exhibit 1: Quarterly GDP trends
Exhibit 2: IIP trends
(%)
(%)
8.6
9.0
8.4
7.0
8.3
5.7
7.7
7.8
6.0
8.0
7.4
7.2
5.0
6.9
7.0
6.8
7.0
4.0
2.7
6.0
3.0
2.2
6.0
5.6
1.3
2.0
0.7
1.0
0.3
5.0
-
4.0
(1.0)
(0.1)
(0.7)
(2.0)
3.0
(1.3)
(3.0)
(1.9)
(2.5)
Source: CSO, Angel Research
Source: MOSPI, Angel Research
Exhibit 3: Monthly CPI inflation trends
Exhibit 4: Manufacturing and services PMI
56.0
Mfg. PMI
Services PMI
(%)
7.0
54.0
6.1
5.8
5.8
6.0
5.5
5.1
52.0
4.8
5.0
4.3
4.2
50.0
3.6
3.7
4.0
3.4
3.2
48.0
3.0
46.0
2.0
1.0
44.0
-
42.0
Source: MOSPI, Angel Research
Source: Market, Angel Research; Note: Level above 50 indicates expansion
Exhibit 5: Exports and imports growth trends
Exhibit 6: Key policy rates
(%)
Exports yoy growth
Imports yoy growth
D
30.0
(%)
Repo rate
Reverse Repo rate
CRR
7.00
20.0
6.50
10.0
6.00
5.50
0.0
5.00
(10.0)
4.50
4.00
(20.0)
3.50
(30.0)
3.00
Source: Bloomberg, Angel Research
Source: RBI, Angel Research
Market Outlook
April 5, 2017
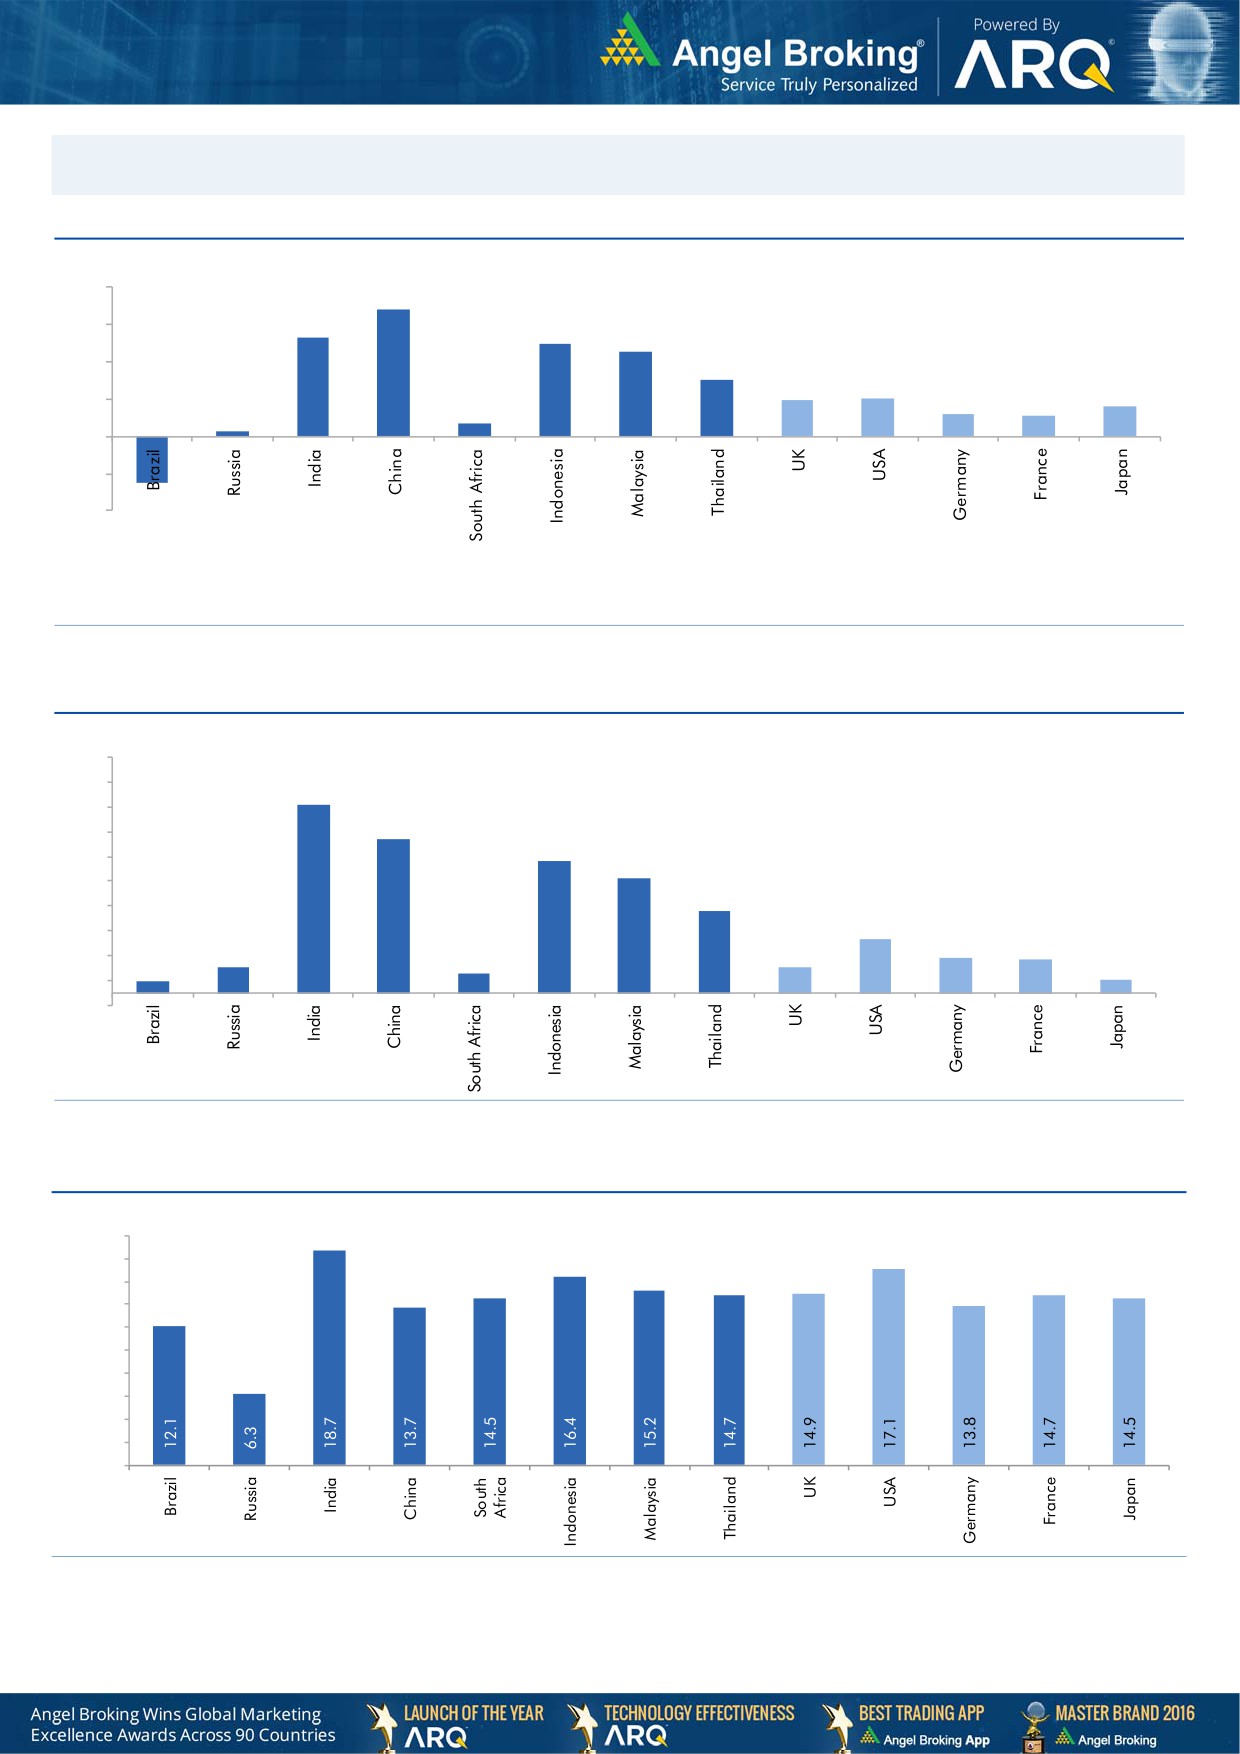
Global watch
Exhibit 1: Latest quarterly GDP Growth (%, yoy) across select developing and developed countries
(%)
8.0
6.8
0.7
5.3
6.0
4.9
4.5
4.0
3.0
0.3
1.9
2.0
1.2
1.6
1.1
2.0
-
(2.0)
(2.5)
(4.0)
Source: Bloomberg, Angel Research
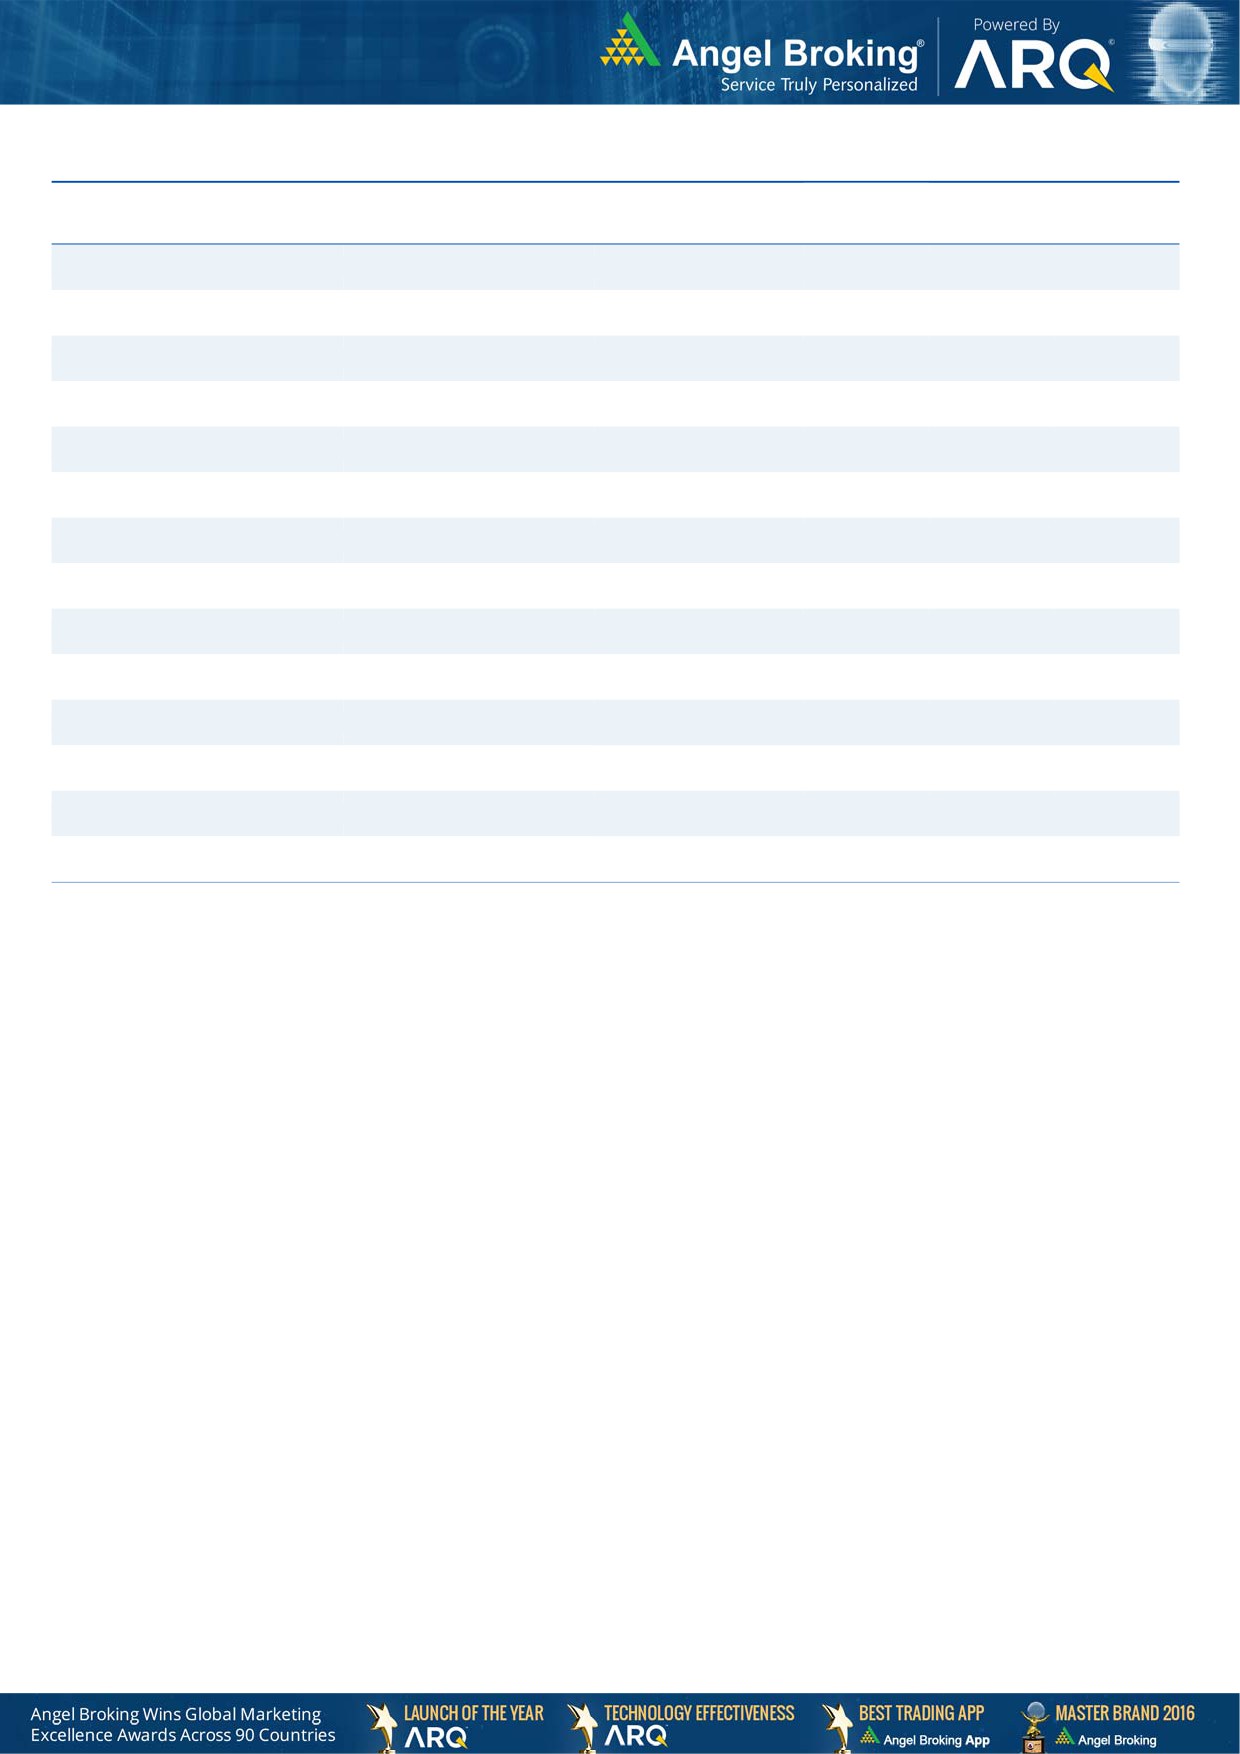
Exhibit 2: 2017 GDP Growth projection by IMF (%, yoy) across select developing and developed countries
(%)
9.5
8.5
7.6
7.5
6.2
6.5
5.3
5.5
4.6
4.5
3.3
3.5
2.2
2.5
1.1
1.4
1.3
1.1
1.5
0.5
0.8
0.6
0.5
(0.5)
Source: IMF, Angel Research
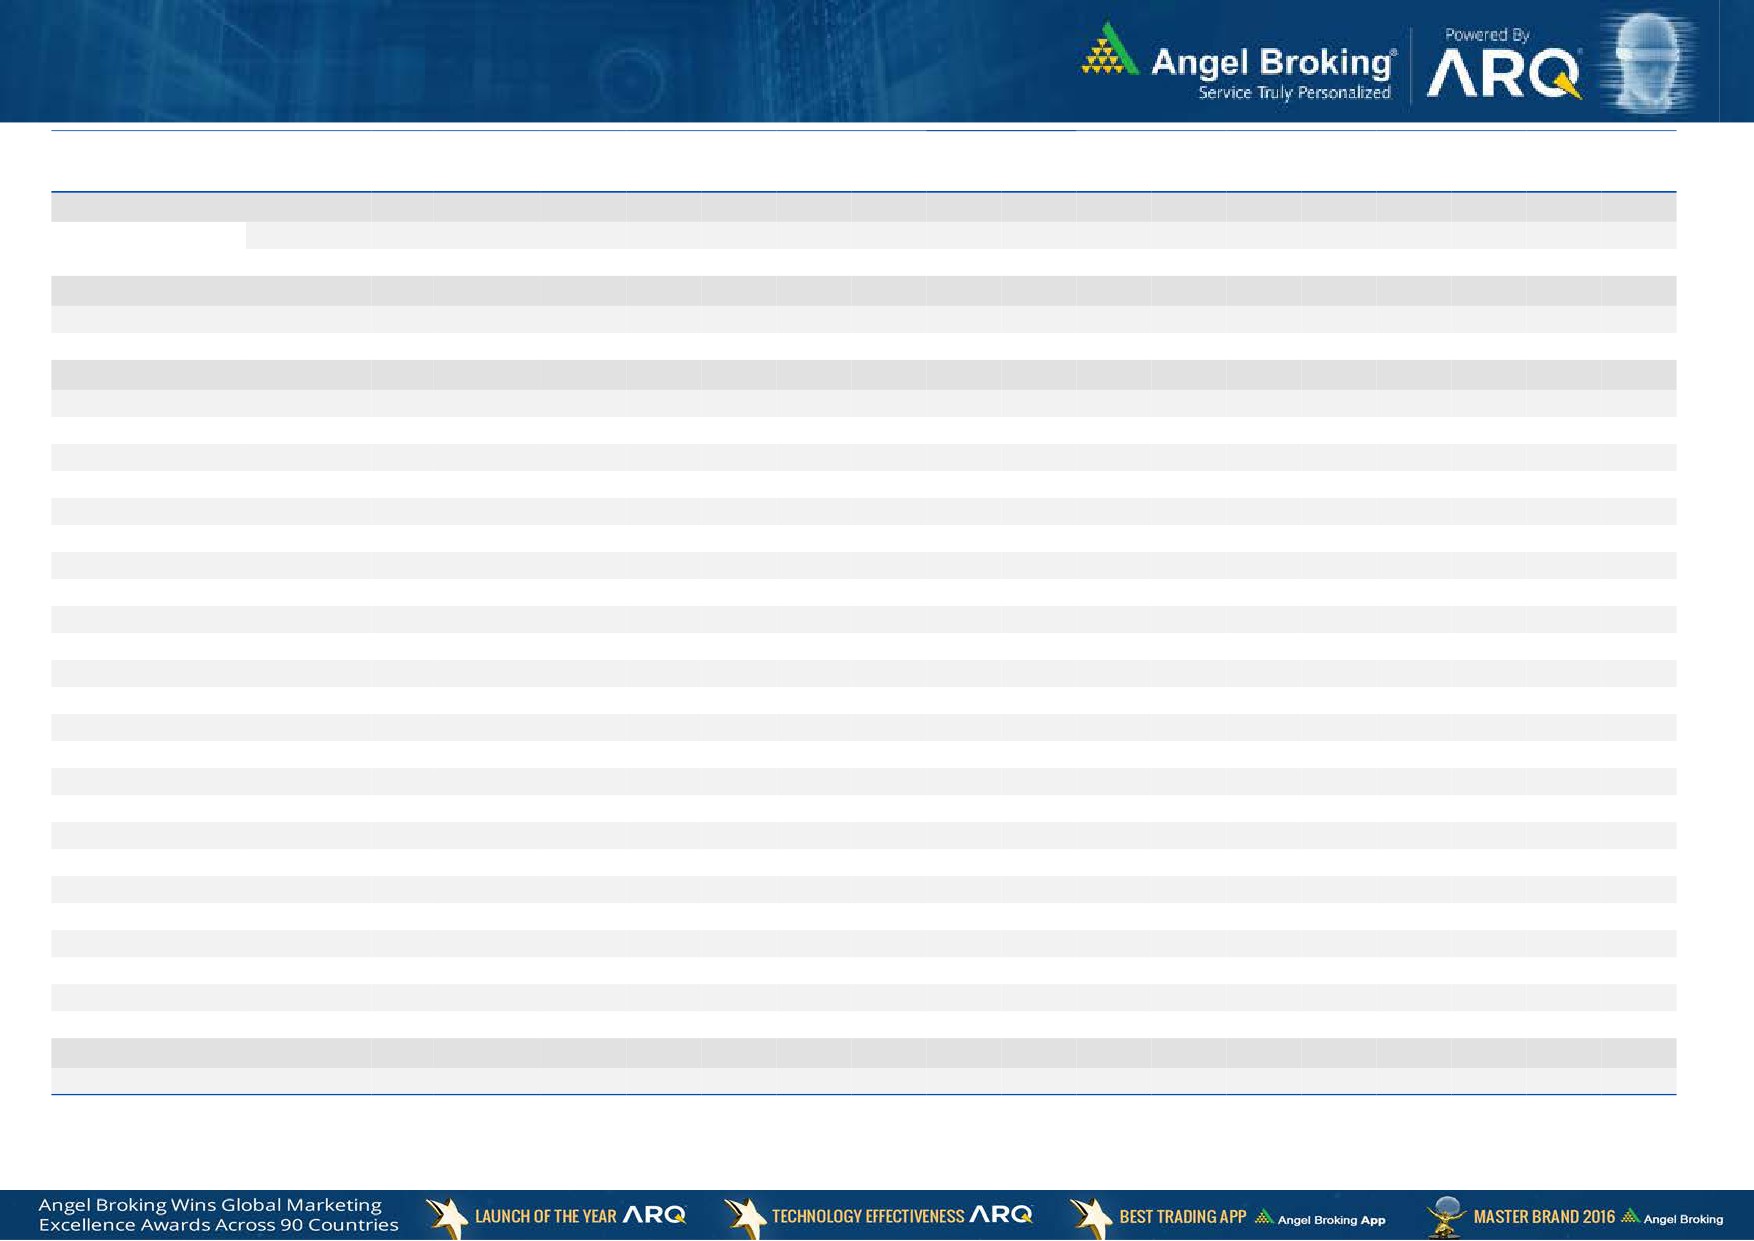
Exhibit 3: One year forward P-E ratio across select developing and developed countries
(x)
20.0
18.0
16.0
14.0
12.0
10.0
8.0
6.0
4.0
2.0
-
Source: IMF, Angel Research, ,# As of 01st April 2017
Market Outlook
April 5, 2017
Exhibit 4: Relative performance of indices across globe
Returns (%)
Country
Name of index
Closing price
1M
3M
1YR
Brazil
Bovespa
64,984
(3.0)
10.7
29.8
Russia
Micex
1,996
(2.0)
(8.6)
6.9
India
Nifty
9,174
3.3
14.2
20.5
China
Shanghai Composite
3,223
(0.8)
3.6
7.4
South Africa
Top 40
45,167
2.3
2.7
(2.1)
Mexico
Mexbol
48,542
3.6
5.7
7.2
Indonesia
LQ45
922
3.2
6.2
9.9
Malaysia
KLCI
1,740
2.5
7.4
2.1
Thailand
SET 50
996
1.1
4.7
10.9
USA
Dow Jones
20,663
(2.1)
4.2
16.5
UK
FTSE
7,323
(0.8)
2.5
18.8
Japan
Nikkei
18,909
(1.1)
(2.5)
11.2
Germany
DAX
12,313
2.0
6.2
27.2
France
CAC
5,123
3.3
4.9
14.1
Source: Bloomberg, Angel Research,# As of 01st April 2017
Stock Watch
April 05, 2017
Company Name
Reco
CMP
Target
Mkt Cap
Sales ( Čcr )
OPM(%)
EPS (Č)
PER(x)
P/BV(x)
RoE(%)
EV/Sales(x)
(Č)
Price ( Č)
( Č cr )
FY17E
FY18E
FY17E
FY18E
FY17E
FY18E
FY17E
FY18E
FY17E
FY18E
FY17E
FY18E
FY17E
FY18E
6,577.0
6,907.0
Agri / Agri Chemical
Rallis
Neutral
253
-
4,929
1,937
2,164
13.3
14.3
9.0
11.0
28.2
23.0
4.9
4.3
18.4
19.8
2.6
2.3
United Phosphorus
Neutral
736
-
37,294
15,176
17,604
18.5
18.5
37.4
44.6
19.7
16.5
3.9
3.2
21.4
21.2
2.6
2.2
Auto & Auto Ancillary
Ashok Leyland
Buy
84
111
23,934
20,021
21,915
11.6
11.9
4.5
5.3
18.7
15.8
3.8
3.4
20.6
21.5
1.1
1.0
Bajaj Auto
Neutral
2,784
-
80,557
25,093
27,891
19.5
19.2
143.9
162.5
19.3
17.1
5.4
4.7
30.3
29.4
2.9
2.6
Bharat Forge
Neutral
1,076
-
25,051
7,726
8,713
20.5
21.2
35.3
42.7
30.5
25.2
5.6
5.1
18.9
20.1
3.3
2.9
Eicher Motors
Neutral
25,544
-
69,505
16,583
20,447
17.5
18.0
598.0
745.2
42.7
34.3
14.6
11.1
41.2
38.3
4.0
3.2
Gabriel India
Neutral
125
-
1,798
1,544
1,715
9.0
9.3
5.4
6.3
23.2
19.9
4.4
3.9
18.9
19.5
1.1
1.0
Hero Motocorp
Accumulate
3,205
3,446
63,997
28,083
30,096
15.3
15.7
171.8
187.0
18.7
17.1
6.5
5.5
30.1
27.9
2.1
1.9
Jamna Auto Industries Neutral
215
-
1,712
1,486
1,620
9.8
9.9
15.0
17.2
14.3
12.5
3.1
2.7
21.8
21.3
1.2
1.1
L G Balakrishnan & Bros Neutral
632
-
991
1,302
1,432
11.6
11.9
43.7
53.0
14.5
11.9
2.0
1.9
13.8
14.2
0.9
0.8
Mahindra and Mahindra Neutral
1,285
-
79,829
46,534
53,077
11.6
11.7
67.3
78.1
19.1
16.5
3.1
2.7
15.4
15.8
1.7
1.4
Maruti
Accumulate
6,072
6,560
183,434
67,822
83,288
16.0
16.4
253.8
312.4
23.9
19.4
5.5
4.5
23.0
22.9
2.4
1.9
Minda Industries
Neutral
440
-
3,493
2,728
3,042
9.0
9.1
68.2
86.2
6.5
5.1
1.5
1.2
23.8
24.3
1.3
1.2
Motherson Sumi
Neutral
376
-
52,775
45,896
53,687
7.8
8.3
13.0
16.1
28.8
23.4
9.3
7.4
34.7
35.4
1.2
1.0
Rane Brake Lining
Neutral
1,029
-
814
511
562
11.3
11.5
28.1
30.9
36.6
33.3
5.6
5.1
15.3
15.0
1.7
1.6
Setco Automotive
Neutral
36
-
478
741
837
13.0
13.0
15.2
17.0
2.4
2.1
0.4
0.4
15.8
16.3
1.0
0.9
Tata Motors
Neutral
470
-
135,835
300,209
338,549
8.9
8.4
42.7
54.3
11.0
8.7
1.8
1.5
15.6
17.2
0.6
0.5
TVS Motor
Neutral
435
-
20,676
13,390
15,948
6.9
7.1
12.8
16.5
34.1
26.3
8.5
6.7
26.3
27.2
1.6
1.3
Amara Raja Batteries
Accumulate
909
1,009
15,526
5,305
6,100
16.0
16.3
28.4
34.0
32.0
26.7
6.2
5.2
19.3
19.3
2.9
2.5
Exide Industries
Neutral
230
-
19,529
7,439
8,307
15.0
15.0
8.1
9.3
28.4
24.7
4.0
3.6
14.3
16.7
2.2
2.0
Apollo Tyres
Accumulate
210
235
10,695
12,877
14,504
14.3
13.9
21.4
23.0
9.8
9.1
1.5
1.3
16.4
15.2
1.0
0.9
Ceat
Accumulate
1,335
1,450
5,399
7,524
8,624
13.0
12.7
131.1
144.3
10.2
9.3
1.9
1.6
19.8
18.6
0.8
0.7
JK Tyres
Neutral
133
-
3,022
7,455
8,056
15.0
15.0
21.8
24.5
6.1
5.4
1.3
1.0
22.8
21.3
0.5
0.4
Swaraj Engines
Neutral
1,483
-
1,841
660
810
15.2
16.4
54.5
72.8
27.2
20.4
8.5
7.7
31.5
39.2
2.6
2.1
Subros
Neutral
218
-
1,309
1,488
1,681
11.7
11.9
6.4
7.2
34.1
30.4
3.6
3.3
10.8
11.4
1.1
1.0
Indag Rubber
Neutral
221
-
579
286
326
19.8
16.8
11.7
13.3
18.9
16.6
3.2
3.0
17.8
17.1
1.7
1.5
Capital Goods
ACE
Neutral
62
-
616
709
814
4.1
4.6
1.4
2.1
44.5
29.6
1.8
1.7
4.4
6.0
1.0
0.9
Stock Watch
April 05, 2017
Company Name
Reco
CMP
Target
Mkt Cap
Sales ( Čcr )
OPM(%)
EPS (Č)
PER(x)
P/BV(x)
RoE(%)
EV/Sales(x)
(Č)
Price ( Č)
( Č cr )
FY17E
FY18E
FY17E
FY18E
FY17E
FY18E
FY17E
FY18E
FY17E
FY18E
FY17E
FY18E
FY17E
FY18E
Capital Goods
BEML
Neutral
1,368
-
5,699
3,451
4,055
6.3
9.2
31.4
57.9
43.6
23.6
2.6
2.4
6.3
10.9
1.8
1.5
Bharat Electronics
Neutral
160
-
35,716
8,137
9,169
16.8
17.2
58.7
62.5
2.7
2.6
0.4
0.4
44.6
46.3
3.4
3.0
Voltas
Neutral
414
-
13,710
6,511
7,514
7.9
8.7
12.9
16.3
32.1
25.4
5.8
5.1
16.7
18.5
1.9
1.6
BGR Energy
Neutral
143
-
1,031
16,567
33,848
6.0
5.6
7.8
5.9
18.3
24.2
1.0
1.0
4.7
4.2
0.2
0.1
BHEL
Neutral
167
-
40,875
28,797
34,742
-
2.8
2.3
6.9
72.6
24.2
1.2
1.2
1.3
4.8
1.1
0.8
Blue Star
Accumulate
706
760
6,749
4,283
5,077
5.9
7.3
14.9
22.1
47.4
31.9
9.2
7.8
20.4
26.4
1.6
1.4
CG Power and Industrial
Neutral
80
-
5,001
5,777
6,120
5.9
7.0
3.3
4.5
24.2
17.7
1.1
1.0
4.4
5.9
0.8
0.7
Solutions
Greaves Cotton
Neutral
170
-
4,148
1,755
1,881
16.8
16.9
7.8
8.5
21.8
20.0
4.4
4.0
20.6
20.9
2.1
1.9
Inox Wind
Neutral
174
-
3,869
5,605
6,267
15.7
16.4
24.8
30.0
7.0
5.8
2.0
1.4
25.9
24.4
0.7
0.6
KEC International
Neutral
212
-
5,437
9,294
10,186
7.9
8.1
9.9
11.9
21.4
17.8
3.1
2.7
15.6
16.3
0.8
0.7
KEI Industries
Accumulate
190
207
1,475
2,682
3,058
10.4
10.0
11.7
12.8
16.2
14.8
3.2
2.7
20.1
18.2
0.8
0.7
Thermax
Neutral
976
-
11,625
5,421
5,940
7.3
7.3
25.7
30.2
38.0
32.3
4.6
4.2
12.2
13.1
2.0
1.9
VATech Wabag
Neutral
688
-
3,757
3,136
3,845
8.9
9.1
26.0
35.9
26.5
19.2
3.3
2.8
13.4
15.9
1.1
0.9
Cement
ACC
Neutral
1,460
-
27,421
11,225
13,172
13.2
16.9
44.5
75.5
32.8
19.3
3.1
2.9
11.2
14.2
2.4
2.1
Ambuja Cements
Neutral
236
-
46,871
9,350
10,979
18.2
22.5
5.8
9.5
40.7
24.9
3.4
3.1
10.2
12.5
5.0
4.3
India Cements
Neutral
164
-
5,041
4,364
4,997
18.5
19.2
7.9
11.3
20.8
14.5
1.5
1.5
8.0
8.5
1.9
1.7
JK Cement
Neutral
943
-
6,594
4,398
5,173
15.5
17.5
31.2
55.5
30.2
17.0
3.6
3.1
12.0
15.5
2.0
1.7
J K Lakshmi Cement
Neutral
465
-
5,475
2,913
3,412
14.5
19.5
7.5
22.5
62.0
20.7
3.8
3.2
12.5
18.0
2.5
2.1
Orient Cement
Neutral
140
-
2,868
2,114
2,558
18.5
20.5
8.1
11.3
17.3
12.4
2.6
2.2
9.0
14.0
2.0
1.5
UltraTech Cement
Neutral
4,025
-
110,481
25,768
30,385
21.0
23.5
111.0
160.0
36.3
25.2
4.6
4.1
13.5
15.8
4.4
3.7
Construction
ITNL
Neutral
111
-
3,663
8,946
10,017
31.0
31.6
8.1
9.1
13.8
12.2
0.5
0.5
4.2
5.0
3.7
3.5
KNR Constructions
Neutral
197
-
2,765
1,385
1,673
14.7
14.0
41.2
48.5
4.8
4.1
0.9
0.8
14.9
15.2
2.1
1.7
Larsen & Toubro
Neutral
1,661
-
154,933
111,017
124,908
11.0
11.0
61.1
66.7
27.2
24.9
3.3
3.0
13.1
12.9
2.4
2.2
Gujarat Pipavav Port
Neutral
166
-
8,040
705
788
52.2
51.7
5.0
5.6
33.3
29.7
3.3
2.9
11.2
11.2
11.1
9.4
Nagarjuna Const.
Neutral
84
-
4,645
8,842
9,775
9.1
8.8
5.3
6.4
15.8
13.1
1.3
1.1
8.2
9.1
0.7
0.6
PNC Infratech
Accumulate
126
143
3,231
2,350
2,904
13.1
13.2
9.0
8.8
14.0
14.3
0.5
0.5
15.9
13.9
1.5
1.2
Simplex Infra
Neutral
311
-
1,540
6,829
7,954
10.5
10.5
31.4
37.4
9.9
8.3
1.0
0.9
9.9
13.4
0.7
0.6
Power Mech Projects
Neutral
550
-
809
1,801
2,219
12.7
14.6
72.1
113.9
7.6
4.8
1.4
1.2
16.8
11.9
0.5
0.3
Sadbhav Engineering
Neutral
304
-
5,223
3,598
4,140
10.3
10.6
9.0
11.9
33.8
25.6
3.5
3.1
9.9
11.9
1.7
1.5
Stock Watch
April 05, 2017
Company Name
Reco
CMP
Target
Mkt Cap
Sales ( Čcr )
OPM(%)
EPS (Č)
PER(x)
P/BV(x)
RoE(%)
EV/Sales(x)
(Č)
Price ( Č)
( Č cr )
FY17E
FY18E
FY17E
FY18E
FY17E
FY18E
FY17E
FY18E
FY17E
FY18E
FY17E
FY18E
FY17E
FY18E
Construction
NBCC
Neutral
173
-
15,597
7,428
9,549
7.9
8.6
8.2
11.0
21.1
15.8
1.1
0.8
28.2
28.7
1.8
1.4
MEP Infra
Neutral
59
-
962
1,877
1,943
30.6
29.8
3.0
4.2
19.7
14.1
9.5
6.4
0.6
0.6
1.9
1.7
SIPL
Neutral
98
-
3,457
1,036
1,252
65.5
66.2
(8.4)
(5.6)
3.7
4.2
(22.8)
(15.9)
11.6
9.6
Engineers India
Neutral
144
-
9,727
1,725
1,935
16.0
19.1
11.4
13.9
12.7
10.4
1.8
1.7
13.4
15.3
4.6
4.1
Financials
Axis Bank
Buy
499
580
119,422
46,932
53,575
3.5
3.4
32.4
44.6
15.4
11.2
2.0
1.7
13.6
16.5
-
-
Bank of Baroda
Neutral
172
-
39,735
19,980
23,178
1.8
1.8
11.5
17.3
15.0
10.0
1.7
1.4
8.3
10.1
-
-
Canara Bank
Neutral
304
-
16,502
15,225
16,836
1.8
1.8
14.5
28.0
21.0
10.9
1.5
1.2
5.8
8.5
-
-
Can Fin Homes
Neutral
2,324
-
6,187
420
526
3.5
3.5
86.5
107.8
26.9
21.6
5.8
4.7
23.6
24.1
-
-
Cholamandalam Inv. &
Buy
973
1,230
15,207
2,012
2,317
6.3
6.3
42.7
53.6
22.8
18.2
3.6
3.1
16.9
18.3
-
-
Fin. Co.
Dewan Housing Finance Neutral
373
-
11,674
2,225
2,688
2.9
2.9
29.7
34.6
12.6
10.8
2.0
1.7
16.1
16.8
-
-
Equitas Holdings
Buy
171
235
5,762
939
1,281
11.7
11.5
5.8
8.2
29.4
20.8
2.5
2.3
10.9
11.5
-
-
Federal Bank
Neutral
90
-
15,585
8,259
8,995
3.0
3.0
4.3
5.6
21.0
16.2
1.8
1.6
8.5
10.1
-
-
HDFC
Neutral
1,533
-
243,438
11,475
13,450
3.4
3.4
45.3
52.5
33.8
29.2
6.5
5.8
20.2
20.5
-
-
HDFC Bank
Neutral
1,433
-
367,136
46,097
55,433
4.5
4.5
58.4
68.0
24.5
21.1
4.3
3.6
18.8
18.6
-
-
ICICI Bank
Accumulate
287
315
167,015
42,800
44,686
3.1
3.3
18.0
21.9
15.9
13.1
2.2
2.0
11.1
12.3
-
-
Lakshmi Vilas Bank
Neutral
169
-
3,228
3,339
3,799
2.7
2.8
11.0
14.0
15.3
12.0
1.6
1.5
11.2
12.7
-
-
LIC Housing Finance
Neutral
625
-
31,539
3,712
4,293
2.6
2.5
39.0
46.0
16.0
13.6
3.0
2.6
19.9
20.1
-
-
Punjab Natl.Bank
Neutral
150
-
31,909
23,532
23,595
2.3
2.4
6.8
12.6
22.1
11.9
3.4
2.4
3.3
6.5
-
-
RBL Bank
Neutral
507
-
18,764
1,783
2,309
2.6
2.6
12.7
16.4
40.0
30.9
4.4
3.9
12.8
13.3
-
-
Repco Home Finance
Buy
722
825
4,515
388
457
4.5
4.2
30.0
38.0
24.1
19.0
4.0
3.4
18.0
19.2
-
-
South Ind.Bank
Neutral
22
-
2,921
6,435
7,578
2.5
2.5
2.7
3.1
8.0
7.0
1.0
0.9
10.1
11.2
-
-
St Bk of India
Neutral
293
-
233,743
88,650
98,335
2.6
2.6
13.5
18.8
21.7
15.6
2.1
1.8
7.0
8.5
-
-
Union Bank
Neutral
155
-
10,686
13,450
14,925
2.3
2.3
25.5
34.5
6.1
4.5
0.9
0.8
7.5
10.2
-
-
Yes Bank
Neutral
1,539
-
65,213
8,978
11,281
3.3
3.4
74.0
90.0
20.8
17.1
4.0
3.4
17.0
17.2
-
-
FMCG
Akzo Nobel India
Neutral
1,962
-
9,409
2,955
3,309
13.3
13.7
57.2
69.3
34.3
28.3
11.2
9.4
32.7
33.3
3.0
2.6
Asian Paints
Neutral
1,091
-
104,658
17,128
18,978
16.8
16.4
19.1
20.7
57.1
52.7
19.9
18.8
34.8
35.5
6.0
5.4
Britannia
Accumulate
3,394
3,626
40,726
9,594
11,011
14.6
14.9
80.3
94.0
42.3
36.1
17.4
13.4
41.2
-
4.1
3.5
Colgate
Neutral
1,006
-
27,369
4,605
5,149
23.4
23.4
23.8
26.9
42.3
37.4
23.4
18.3
64.8
66.8
5.9
5.2
Dabur India
Accumulate
280
304
49,270
8,315
9,405
19.8
20.7
8.1
9.2
34.5
30.4
9.6
8.0
31.6
31.0
5.6
4.9
Stock Watch
April 05, 2017
Company Name
Reco
CMP
Target
Mkt Cap
Sales ( Čcr )
OPM(%)
EPS (Č)
PER(x)
P/BV(x)
RoE(%)
EV/Sales(x)
(Č)
Price ( Č)
( Č cr )
FY17E FY18E
FY17E
FY18E
FY17E
FY18E
FY17E
FY18E
FY17E
FY18E
FY17E
FY18E
FY17E
FY18E
FMCG
GlaxoSmith Con*
Neutral
5,194
-
21,844
4,350
4,823
21.2
21.4
179.2
196.5
29.0
26.4
7.7
6.5
27.1
26.8
4.4
3.9
Godrej Consumer
Neutral
1,694
-
57,703
10,235
11,428
18.4
18.6
41.1
44.2
41.2
38.3
9.1
7.7
24.9
24.8
5.7
5.1
HUL
Neutral
919
-
198,806
35,252
38,495
17.8
17.8
20.7
22.4
44.5
41.0
42.5
36.5
95.6
88.9
5.5
5.0
ITC
Neutral
282
-
342,192
40,059
44,439
38.3
39.2
9.0
10.1
31.4
27.8
8.8
7.6
27.8
27.5
8.0
7.2
Marico
Neutral
296
-
38,182
6,430
7,349
18.8
19.5
6.4
7.7
46.2
38.4
14.0
11.7
33.2
32.5
5.8
5.0
Nestle*
Neutral
6,577
-
63,411
10,073
11,807
20.7
21.5
124.8
154.2
52.7
42.7
21.6
19.5
34.8
36.7
6.1
5.2
Tata Global
Neutral
152
-
9,587
8,675
9,088
9.8
9.8
7.4
8.2
20.5
18.5
1.6
1.5
7.9
8.1
1.0
1.0
Procter & Gamble
Neutral
7,387
-
23,978
2,939
3,342
23.2
23.0
146.2
163.7
50.5
45.1
12.8
10.6
25.3
23.5
7.7
6.7
Hygiene
IT
HCL Tech^
Buy
865
1,000
122,099
49,242
57,168
20.5
20.5
55.7
64.1
15.5
13.5
3.2
2.4
20.3
17.9
2.3
1.9
Infosys
Buy
1,009
1,249
231,865
68,350
77,326
27.0
27.0
62.5
69.4
16.2
14.6
3.5
3.1
21.3
21.6
2.8
2.5
TCS
Accumulate
2,413
2,700
475,523
119,025
133,308
27.6
27.6
131.2
145.5
18.4
16.6
6.0
5.5
32.4
33.1
3.8
3.3
Tech Mahindra
Buy
453
600
44,136
29,673
32,937
15.5
17.0
32.8
39.9
13.8
11.4
2.7
2.4
19.6
20.7
1.2
1.0
Wipro
Accumulate
507
583
123,271
55,440
60,430
18.1
18.1
36.1
38.9
14.1
13.0
2.5
2.3
19.0
17.6
1.9
1.7
Media
D B Corp
Neutral
381
-
7,005
2,297
2,590
27.4
28.2
21.0
23.4
18.1
16.3
4.2
3.7
23.7
23.1
2.9
2.5
HT Media
Neutral
84
-
1,952
2,693
2,991
12.6
12.9
7.9
9.0
10.6
9.3
0.9
0.8
7.8
8.3
0.3
0.2
Jagran Prakashan
Buy
186
225
6,095
2,355
2,635
28.0
28.0
10.8
12.5
17.3
14.9
3.7
3.2
21.7
21.7
2.6
2.3
Sun TV Network
Neutral
795
-
31,347
2,850
3,265
70.1
71.0
26.2
30.4
30.4
26.2
7.8
6.9
24.3
25.6
10.6
9.1
Hindustan Media
Neutral
284
-
2,084
1,016
1,138
24.3
25.2
27.3
30.1
10.4
9.4
2.0
1.8
16.2
15.8
1.4
1.2
Ventures
TV Today Network
Buy
260
344
1,552
567
645
26.7
27.0
15.4
18.1
16.9
14.4
2.5
2.2
14.9
15.2
2.3
1.9
Metals & Mining
Coal India
Neutral
295
-
183,119
84,638
94,297
21.4
22.3
24.5
27.1
12.0
10.9
5.0
4.8
42.6
46.0
1.7
1.5
Hind. Zinc
Neutral
292
-
123,337
14,252
18,465
55.9
48.3
15.8
21.5
18.5
13.6
3.0
2.6
17.0
20.7
8.7
6.7
Hindalco
Neutral
194
-
40,005
107,899
112,095
7.4
8.2
9.2
13.0
21.0
14.9
1.0
1.0
4.8
6.6
0.9
0.8
JSW Steel
Neutral
189
-
45,758
53,201
58,779
16.1
16.2
130.6
153.7
1.5
1.2
0.2
0.2
14.0
14.4
1.6
1.4
NMDC
Neutral
134
-
42,270
6,643
7,284
44.4
47.7
7.1
7.7
18.8
17.4
1.6
1.6
8.8
9.2
4.1
3.7
SAIL
Neutral
63
-
26,040
47,528
53,738
(0.7)
2.1
(1.9)
2.6
24.3
0.7
0.7
(1.6)
3.9
1.4
1.3
Vedanta
Neutral
273
-
80,847
71,744
81,944
19.2
21.7
13.4
20.1
20.4
13.6
1.7
1.6
8.4
11.3
1.5
1.2
Tata Steel
Neutral
485
-
47,138
121,374
121,856
7.2
8.4
18.6
34.3
26.1
14.2
1.6
1.5
6.1
10.1
1.0
1.0
Oil & Gas
Cairn India
Neutral
304
-
57,102
9,127
10,632
4.3
20.6
8.8
11.7
34.6
26.0
1.1
1.1
3.3
4.2
7.7
6.5
GAIL
Neutral
385
-
65,124
56,220
65,198
9.3
10.1
27.1
33.3
14.2
11.6
1.3
1.2
9.3
10.7
1.3
1.1
Stock Watch
April 05, 2017
Company Name
Reco
CMP
Target
Mkt Cap
Sales ( Čcr )
OPM(%)
EPS (Č)
PER(x)
P/BV(x)
RoE(%)
EV/Sales(x)
(Č)
Price ( Č)
( Č cr )
FY17E FY18E
FY17E
FY18E
FY17E
FY18E
FY17E
FY18E
FY17E
FY18E
FY17E
FY18E
FY17E
FY18E
Oil & Gas
ONGC
Neutral
186
-
238,377
137,222
152,563
15.0
21.8
19.5
24.1
9.5
7.7
0.8
0.8
8.5
10.1
2.0
1.8
Indian Oil Corp
Neutral
381
-
185,083
373,359
428,656
5.9
5.5
54.0
59.3
7.1
6.4
1.1
1.0
16.0
15.6
0.7
0.6
Reliance Industries
Neutral
1,371
-
445,815
301,963
358,039
12.1
12.6
87.7
101.7
15.6
13.5
1.6
1.5
10.7
11.3
2.0
1.6
Pharmaceuticals
Alembic Pharma
Accumulate
620
689
11,680
3,483
4,244
20.2
21.4
24.3
33.6
25.5
18.4
5.8
4.6
25.5
25.3
3.3
2.6
Alkem Laboratories Ltd
Neutral
2,163
-
25,866
6,065
7,009
18.7
20.0
80.2
92.0
27.0
23.5
6.1
5.1
22.5
21.6
4.2
3.6
Aurobindo Pharma
Buy
681
877
39,901
15,720
18,078
23.7
23.7
41.4
47.3
16.5
14.4
4.3
3.3
29.6
26.1
2.8
2.4
Aventis*
Neutral
4,749
-
10,938
2,277
2,597
16.6
17.4
128.9
157.0
36.9
30.3
6.3
4.8
21.6
26.4
4.6
3.8
Cadila Healthcare
Neutral
444
-
45,434
10,429
12,318
17.7
21.6
13.1
19.2
33.9
23.1
7.1
5.6
22.8
27.1
4.4
3.6
Cipla
Sell
592
465
47,607
15,378
18,089
15.7
16.8
19.3
24.5
30.7
24.2
3.6
3.2
12.3
13.9
3.3
2.7
Dr Reddy's
Neutral
2,746
-
45,498
16,043
18,119
18.0
23.0
78.6
130.9
34.9
21.0
3.4
3.0
10.1
15.2
2.6
2.5
Dishman Pharma
Sell
324
143
5,222
1,718
1,890
22.7
22.8
9.5
11.3
34.1
28.6
3.3
3.0
10.1
10.9
3.5
3.1
GSK Pharma*
Neutral
2,724
-
23,076
2,800
3,290
10.2
20.6
32.2
60.3
84.6
45.2
15.7
15.5
17.2
34.5
8.0
6.9
Indoco Remedies
Neutral
229
-
2,110
1,112
1,289
16.2
18.2
11.6
16.0
19.7
14.3
3.2
2.7
17.0
20.1
2.0
1.7
Ipca labs
Neutral
632
-
7,968
3,258
3,747
12.8
15.3
12.1
19.2
52.2
32.9
3.3
3.0
6.4
9.5
2.6
2.2
Lupin
Buy
1,435
1,809
64,781
15,912
18,644
26.4
26.7
58.1
69.3
24.7
20.7
4.8
3.9
21.4
20.9
4.1
3.4
Sun Pharma
Buy
693
847
166,243
31,129
35,258
32.0
32.9
30.2
35.3
22.9
19.6
3.7
3.1
20.0
20.1
4.9
4.1
Power
Tata Power
Neutral
89
-
24,127
36,916
39,557
17.4
27.1
5.1
6.3
17.5
14.2
1.5
1.4
9.0
10.3
1.7
1.5
NTPC
Neutral
165
-
135,844
86,605
95,545
17.5
20.8
11.8
13.4
14.0
12.3
1.4
1.3
10.5
11.1
2.9
2.9
Power Grid
Accumulate
196
223
102,670
25,315
29,193
88.2
88.7
14.2
17.2
13.9
11.4
2.1
1.8
15.2
16.1
8.7
7.8
Real Estate
Prestige Estate
Neutral
218
-
8,156
4,707
5,105
25.2
26.0
10.3
13.0
21.1
16.7
1.7
1.6
10.3
10.2
2.9
2.6
MLIFE
Buy
391
522
1,606
1,152
1,300
22.7
24.6
29.9
35.8
13.1
10.9
1.0
0.9
7.6
8.6
2.1
1.8
Telecom
Bharti Airtel
Neutral
342
-
136,571
105,086
114,808
34.5
34.7
12.2
16.4
28.0
20.8
1.9
1.8
6.8
8.4
2.2
1.9
Idea Cellular
Neutral
85
-
30,627
40,133
43,731
37.2
37.1
6.4
6.5
13.3
13.1
1.1
1.0
8.2
7.6
1.8
1.5
zOthers
Abbott India
Neutral
4,751
-
10,096
3,153
3,583
14.1
14.4
152.2
182.7
31.2
26.0
153.3
130.9
25.6
26.1
2.9
2.5
Asian Granito
Accumulate
368
390
1,108
1,060
1,169
12.2
12.5
12.7
15.9
29.1
23.2
2.8
2.5
9.5
10.7
1.3
1.2
Bajaj Electricals
Accumulate
373
395
3,776
4,801
5,351
5.7
6.2
10.4
13.7
35.8
27.2
4.4
3.9
12.4
14.5
0.8
0.7
Banco Products (India)
Neutral
232
-
1,659
1,353
1,471
12.3
12.4
14.5
16.3
16.0
14.2
22.1
19.9
14.5
14.6
1.2
125.5
Coffee Day Enterprises
Neutral
232
-
4,787
2,964
3,260
20.5
21.2
4.7
8.0
-
29.0
2.7
2.5
5.5
8.5
2.0
1.8
Ltd
Competent Automobiles Neutral
182
-
112
1,137
1,256
3.1
2.7
28.0
23.6
6.5
7.7
34.9
31.6
14.3
11.5
0.1
0.1
Stock Watch
April 05, 2017
Company Name
Reco
CMP
Target
Mkt Cap
Sales ( Čcr )
OPM(%)
EPS (Č)
PER(x)
P/BV(x)
RoE(%)
EV/Sales(x)
(Č)
Price ( Č)
( Č cr )
FY17E
FY18E
FY17E
FY18E
FY17E
FY18E
FY17E
FY18E
FY17E
FY18E
FY17E
FY18E
FY17E
FY18E
zOthers
Elecon Engineering
Neutral
56
-
628
1,482
1,660
13.7
14.5
3.9
5.8
14.4
9.7
3.4
3.1
7.8
10.9
0.7
0.7
Finolex Cables
Neutral
530
-
8,110
2,883
3,115
12.0
12.1
14.2
18.6
37.3
28.5
19.9
17.4
15.8
14.6
2.5
2.3
Garware Wall Ropes
Neutral
723
-
1,582
863
928
15.1
15.2
36.4
39.4
19.9
18.4
3.6
3.1
17.5
15.9
1.7
1.6
Goodyear India*
Neutral
863
-
1,991
1,598
1,704
10.4
10.2
49.4
52.6
17.5
16.4
80.7
70.8
18.2
17.0
0.9
132.5
Hitachi
Neutral
1,821
-
4,951
2,081
2,433
8.8
8.9
33.4
39.9
54.5
45.6
44.0
36.7
22.1
21.4
2.4
2.0
HSIL
Neutral
349
-
2,522
2,384
2,515
15.8
16.3
15.3
19.4
22.8
18.0
22.7
19.5
7.8
9.3
1.2
1.1
Interglobe Aviation
Neutral
1,043
-
37,701
21,122
26,005
14.5
27.6
110.7
132.1
9.4
7.9
56.4
40.3
168.5
201.1
1.8
1.4
Jyothy Laboratories
Neutral
343
-
6,231
1,440
2,052
11.5
13.0
8.5
10.0
40.4
34.3
9.8
9.1
18.6
19.3
4.6
3.2
Kirloskar Engines India
Neutral
386
-
5,586
2,554
2,800
9.9
10.0
10.5
12.1
36.8
31.9
15.4
14.5
10.7
11.7
1.8
1.6
Ltd
Linc Pen & Plastics
Neutral
296
-
437
382
420
9.3
9.5
13.5
15.7
22.0
18.8
3.8
3.3
17.1
17.3
1.2
1.1
M M Forgings
Neutral
549
-
663
546
608
20.4
20.7
41.3
48.7
13.3
11.3
75.3
66.6
16.6
17.0
1.1
0.9
Manpasand Bever.
Neutral
708
-
4,049
836
1,087
19.6
19.4
16.9
23.8
41.9
29.7
5.0
4.4
12.0
14.8
4.6
3.4
Mirza International
Buy
86
107
1,040
963
1,069
17.2
18.0
6.1
7.5
14.1
11.5
2.2
1.8
15.0
15.7
1.3
1.2
MT Educare
Neutral
86
-
340
366
417
17.7
18.2
9.4
10.8
9.1
7.9
2.0
1.8
22.2
22.3
0.8
0.7
Narayana Hrudaya
Neutral
316
-
6,456
1,873
2,166
11.5
11.7
2.6
4.0
119.4
79.7
7.3
6.6
6.1
8.3
3.5
3.1
Navkar Corporation
Buy
175
265
2,499
369
561
42.9
42.3
6.9
11.5
25.4
15.2
1.8
1.6
7.4
10.5
7.8
5.1
Navneet Education
Neutral
167
-
3,897
1,062
1,147
24.0
24.0
6.1
6.6
27.4
25.2
5.6
5.0
20.6
19.8
3.7
3.5
Nilkamal
Neutral
2,001
-
2,987
1,995
2,165
10.7
10.4
69.8
80.6
28.7
24.8
114.4
99.4
16.6
16.5
1.5
1.3
Page Industries
Neutral
14,579
-
16,261
2,450
3,124
20.1
17.6
299.0
310.0
48.8
47.0
324.7
247.9
47.1
87.5
6.7
5.3
Parag Milk Foods
Neutral
235
-
1,972
1,919
2,231
9.3
9.6
9.5
12.9
24.8
18.1
3.9
3.2
15.5
17.5
1.2
1.0
Quick Heal
Neutral
239
-
1,674
408
495
27.3
27.0
7.7
8.8
30.9
27.2
2.9
2.9
9.3
10.6
3.2
2.7
Radico Khaitan
Accumulate
133
147
1,769
1,667
1,824
13.0
13.2
6.7
8.2
20.0
16.2
1.8
1.7
9.0
10.2
1.5
1.3
Relaxo Footwears
Neutral
498
-
5,985
2,085
2,469
9.2
8.2
7.6
8.0
65.9
62.7
25.6
21.8
17.9
18.8
3.0
2.5
S H Kelkar & Co.
Neutral
300
-
4,334
1,036
1,160
15.1
15.0
6.1
7.2
49.1
41.8
5.2
4.8
10.7
11.5
4.1
3.6
Siyaram Silk Mills
Accumulate
1,701
1,872
1,594
1,652
1,857
11.6
11.7
92.4
110.1
18.4
15.4
2.7
2.4
14.7
15.2
1.2
1.0
Styrolution ABS India*
Neutral
689
-
1,212
1,440
1,537
9.2
9.0
40.6
42.6
17.0
16.2
43.4
39.4
12.3
11.6
0.8
0.7
Surya Roshni
Neutral
215
-
942
3,342
3,625
7.8
7.5
17.3
19.8
12.4
10.9
23.6
19.0
10.5
10.8
0.5
0.5
Team Lease Serv.
Neutral
1,000
-
1,710
3,229
4,001
1.5
1.8
22.8
32.8
43.9
30.5
4.7
4.1
10.7
13.4
0.4
0.3
The Byke Hospitality
Neutral
182
-
731
287
384
20.5
20.5
7.6
10.7
24.0
17.0
5.0
4.1
20.7
23.5
2.6
1.9
Stock Watch
April 05, 2017
Company Name
Reco
CMP
Target Mkt Cap
Sales ( Čcr )
OPM(%)
EPS (Č)
PER(x)
P/BV(x)
RoE(%)
EV/Sales(x)
(Č)
Price ( Č)
( Č cr )
FY17E FY18E FY17E FY18E FY17E FY18E FY17E FY18E FY17E FY18E FY17E FY18E FY17E FY18E
zOthers
Transport Corporation of
Neutral
237
-
1,815
2,671
2,911
8.5
8.8
13.9
15.7
17.1
15.1
2.3
2.1
13.7
13.8
0.8
0.7
India
TVS Srichakra
Neutral
3,487
-
2,670
2,304
2,614
13.7
13.8
231.1
266.6
15.1
13.1
391.8
308.5
33.9
29.3
1.2
1.0
UFO Moviez
Neutral
426
-
1,176
619
685
33.2
33.4
30.0
34.9
14.2
12.2
2.0
1.7
13.8
13.9
1.6
1.3
Visaka Industries
Neutral
286
-
454
1,051
1,138
10.3
10.4
21.0
23.1
13.6
12.3
36.6
34.3
9.0
9.2
0.7
0.7
VRL Logistics
Neutral
317
-
2,889
1,902
2,119
16.7
16.6
14.6
16.8
21.7
18.8
4.8
4.2
21.9
22.2
1.6
1.4
VIP Industries
Neutral
209
-
2,957
1,270
1,450
10.4
10.4
5.6
6.5
37.4
32.2
7.8
6.8
20.7
21.1
2.3
2.0
Navin Fluorine
Buy
3,137
3,650
3,071
789
945
21.1
22.4
120.1
143.4
26.1
21.9
4.2
3.6
17.8
18.5
3.8
3.1
Source: Company, Angel Research; Note: *December year end; #September year end; &October year end; Price as on April 03, 2017
Market Outlook
April 05, 2017
Research Team Tel: 022 - 39357800
DISCLAIMER
Angel Broking Private Limited (hereinafter referred to as “Angel”) is a registered Member of National Stock Exchange of India
Limited,Bombay Stock Exchange Limited and Metropolitan Stock Exchange Limited. It is also registered as a Depository Participant with
CDSL and Portfolio Manager with SEBI. It also has registration with AMFI as a Mutual Fund Distributor. Angel Broking Private Limited is a
registered entity with SEBI for Research Analyst in terms of SEBI (Research Analyst) Regulations, 2014 vide registration number
INH000000164. Angel or its associates has not been debarred/ suspended by SEBI or any other regulatory authority for accessing
/dealing in securities Market. Angel or its associates/analyst has not received any compensation / managed or
co-managed public offering of securities of the company covered by Analyst during the past twelve months.
This document is solely for the personal information of the recipient, and must not be singularly used as the basis of any investment
decision. Nothing in this document should be construed as investment or financial advice. Each recipient of this document should make
such investigations as they deem necessary to arrive at an independent evaluation of an investment in the securities of the companies
referred to in this document (including the merits and risks involved), and should consult their own advisors to determine the merits and
risks of such an investment.
Reports based on technical and derivative analysis center on studying charts of a stock's price movement, outstanding positions and
trading volume, as opposed to focusing on a company's fundamentals and, as such, may not match with a report on a company's
fundamentals. Investors are advised to refer the Fundamental and Technical Research Reports available on our website to evaluate the
contrary view, if any.
The information in this document has been printed on the basis of publicly available information, internal data and other reliable
sources believed to be true, but we do not represent that it is accurate or complete and it should not be relied on as such, as this
document is for general guidance only. Angel Broking Pvt. Limited or any of its affiliates/ group companies shall not be in any way
responsible for any loss or damage that may arise to any person from any inadvertent error in the information contained in this report.
Angel Broking Pvt. Limited has not independently verified all the information contained within this document. Accordingly, we cannot
testify, nor make any representation or warranty, express or implied, to the accuracy, contents or data contained within this document.
While Angel Broking Pvt. Limited endeavors to update on a reasonable basis the information discussed in this material, there may be
regulatory, compliance, or other reasons that prevent us from doing so.
This document is being supplied to you solely for your information, and its contents, information or data may not be reproduced,
redistributed or passed on, directly or indirectly.
Neither Angel Broking Pvt. Limited, nor its directors, employees or affiliates shall be liable for any loss or damage that may arise from
or in connection with the use of this information.